 Below follows Lingyun Lai’s first blogpost:
Since Mittins et al., in their book Attitudes to English usage, reported an overall acceptability of 50 English usage items in 1970, no systematic replication research had been conducted, until, from 2011 onwards, the Bridging the Unbridgeable project carried out a survey to repeat the original Mittins project. In the MA course Testing Prescriptivism Course, we were asked to compare the results of those two studies.
I imported the original polls’ results for the option “unacceptable under any circumstances” into Microsoft Excel 2013, and used the formula (100 – the unacceptable rate) to calculate the general acceptance rate. I similarlyimported the corresponding 1970 data and got the following results:
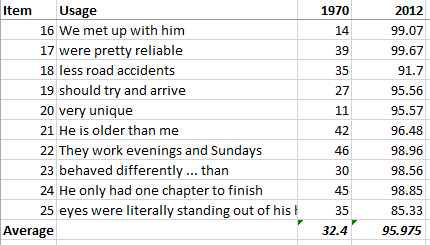
Figure 1. A comparison between 1970 and the Bridging the Unbrdgeable polls
The figures suggest that the acceptance rates for the ten usage problems studied increased drastically since forty years ago. The average rate had risen from 32.4% in 1970 to 95.9% forty years later. Does this trend imply a more tolerant attitude or a decline of prescriptivism in the new millennium?
Before jumping to a conclusion, I decided to explore the data further, and checked other statistics with SPSS 23. I noticed a big difference between the Standard Deviation values for two of the sentence polls, i.s. 12.1 versus 4.4. Standard Deviation is a statistical measure that allows us to observe the degree of variance among observations. My findings mean that the 1970s survey respondents varied their attitudes to different usage items significantly, whereas respondents of 2012 online survey demonstrated a much more homogenized attitude towards all items. See Figure 2 for this difference between the two groups of respondents:
 Figure 2. Group Statistics of the 1970 and 2012 surveys.
Taking both types of results into consideration, I think there could be three possible interpretations:
- The results reflect a genuine picture. After forty years’ debate on prescriptivism, the general public has adopted a much more tolerant attitude towards almost all controversial language usages.
- The differences in variation are an indicator of two different populations (in a statistical sense). The 1970 and 2012 studies were conducted with two different methods: through onsite interviews and an online survey, so perhaps the Bridging the Unbridgeable polls only sampled a subgroup of the general public, the netizens, and perhaps this group of people accepted most of the controversial usages.
- The differences in variation are an indicator of the inefficiency of using online polls. A possible scenario could be that many online respondents did the survey rather casually, and responded all items with a similar pattern.
I would appreciate blog readers’ feedback on this issue!

 Many traditional sources on usage have adapted their format and extended their presence to the online medium, prime examples being style guides of media houses and online dictionaries. New language authorities, however, also emerged and entered the usage advice market. Some of them are written by individual authors – internet “grammar celebrities” – whereas others are products of collaboration and discussions led among lay people and language professionals.
 For example, take a look at the lifestyle blog
